Our roads are designed for driving, but we walk and cycle far more.
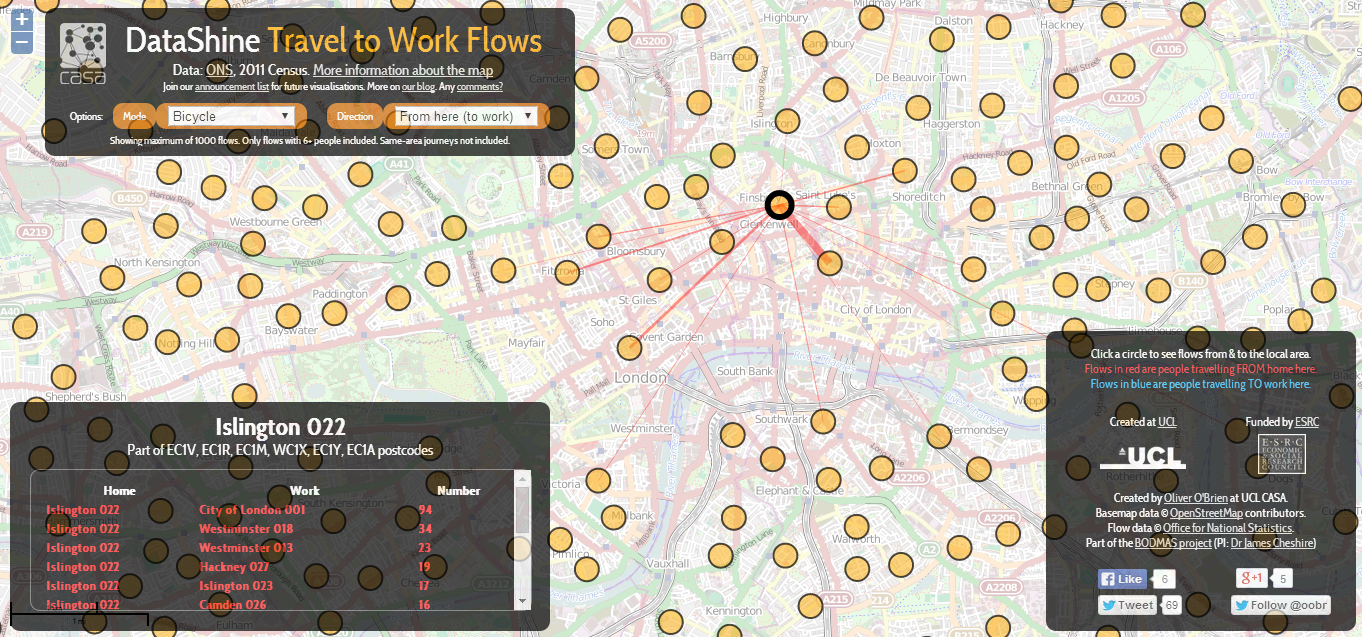
Last week, new census data was released highlighting where people work and how they get there. Then the wonderful people at CASA.UCL made a map for us simpletons to easily see what is happening.
The data is quite extraordinary. Having crunched the numbers, its clear that the overwhelming majority of Clerkenwell and Bunhill residents walk and cycle than get the bus or drive.
- 6483: Walk or Cycle
- 3335: Bus
- 234: Car or Taxi
Of course, this isn’t a completely full travel picture: we all vary our travel routines, and it’s just working age adults commuting, but it is undoubtedly indicative of general trends.
There are two lessons from this fascinating data set:
1. Many journeys by bus and car could easily be walked or cycled (proven by our neighbours making the same journeys).
2. There is now an overwhelming argument to use TfL’s £2m to make cycling and walking the most convenient, obvious modes of travel in the area. Islington Council pioneered 20mph zones, and now they have a strong mandate to develop the most liveable streets in London.
With careful planning and a few planters or “modal filters”, we could cheaply and easily re-focus our streets to reflect the growing demand for active travel. Our planned layout can be seen here:
Please get in touch to add your voice of support for our plans, or to hear more about our work, please do get in touch through
https://www.facebook.com/IslingtonCyclistsActionGroup or